


Abstract
To quantify the arousal burden (AB) across large cohort studies and determine its association with long-term cardiovascular (CV) and overall mortality in men and women.
We measured the AB on overnight polysomnograms of 2782 men in the Osteoporotic Fractures in Men Study (MrOS) Sleep study, 424 women in the Study of Osteoporotic Fractures (SOF) and 2221 men and 2574 women in the Sleep Heart Health Study (SHHS). During 11.2 ± 2.1 years of follow-up in MrOS, 665 men died, including 236 CV deaths. During 6.4 ± 1.6 years of follow-up in SOF, 105 women died, including 47 CV deaths. During 10.7 ± 3.1 years of follow-up in SHHS, 987 participants died, including 344 CV deaths. In women, multivariable Cox proportional hazard analysis adjusted for common confounders demonstrated that AB is associated with all-cause mortality [SOF: hazard ratio (HR) 1.58 (1.01–2.42), P = 0.038; SHHS-women: HR 1.21 (1.06–1.42), P = 0.012] and CV mortality [SOF: HR 2.17 (1.04–4.50), P = 0.037; SHHS-women: HR 1.60 (1.12–2.28), P = 0.009]. In men, the association between AB and all-cause mortality [MrOS: HR 1.11 (0.94–1.32), P = 0.261; SHHS-men: HR 1.31 (1.06–1.62), P = 0.011] and CV mortality [MrOS: HR 1.35 (1.02–1.79), P = 0.034; SHHS-men: HR 1.24 (0.86–1.79), P = 0.271] was less clear.
Nocturnal AB is associated with long-term CV and all-cause mortality in women and to a lesser extent in men.
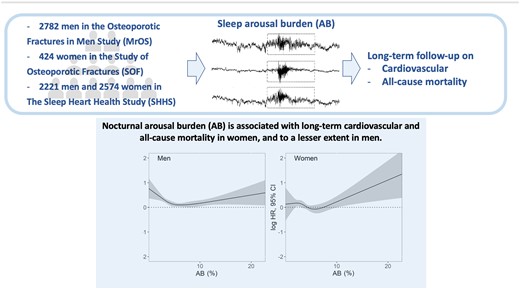
The burden of cortical arousals on overnight polysomnograms was quantified across three large cohort studies and its association with long-term mortality was investigated. An increased cardiovascular and all-cause mortality was observed in women who experienced a high arousal burden. The association was weaker in men.
See page 2100 for the editorial comment on this article (doi: )
Introduction
Insufficient sleep is associated with cardiovascular (CV) disease and fatal CV outcomes.1 A meta-analysis revealed a U-shaped association between self-reported sleep duration and all-cause and CV mortality; both short (≤6 h/day) and long (>8 h/day) self-reported sleep duration are associated with mortality risk.2 In heart failure patients, objectively assessed sleep duration using overnight polysomnography (PSG) shows an inverse linear association with mortality and does not follow the U-shaped association observed with self-reported sleep.3 Indeed, the length of sleep alone does not reflect critical neurophysiological aspects such as sleep quality, sleep continuity, and sleep depth.4 For example, sleep irregularity,5 difficulties initiating sleep, and non-restorative sleep are associated with increased risk of mortality, irrespective of sleep duration.6
Brief intrusions of unconscious wakefulness, so-called cortical arousals, are a normal feature of sleep. They occur spontaneously or are elicited by sleep-disordered breathing (SDB) and periodic limb movements during sleep, trauma, pain, temperature, light, and traffic noise.7 Arousals, irrespective of the underlying mechanism, impact heart rate, blood pressure, and cardiac haemodynamics acutely,8 but, when frequent, may also disrupt the circadian rhythm of the CV system, which is associated with unfavourable metabolic profiles, such as higher blood pressure, dysregulated blood lipids, and insulin resistance.2 Additionally, traffic noise, particularly when occurring during night, has been shown to be a risk factor of CV disease through increased levels of stress hormones and vascular oxidative stress.9 , 10
Clinically, the cause and rate of arousal occurrence are assessed using overnight PSG.11 The arousal index (AI), i.e. the number of arousals per hour of sleep, is often used to quantify the level of sleep fragmentation.12 High AI values are associated with daytime sleepiness,11 poor sleep quality,12 and increased emotional and physical fatigue in patients with SDB. In addition to the rate of arousals, the duration of individual arousal events may further contribute to the extent of sleep fragmentation.13–15 The clinical significance of detailed characterization of the arousal burden (AB) on CV and all-cause mortality remains unknown.
The objective of this study was to determine the nocturnal AB and its association with long-term CV and all-cause mortality in men and women in the broader population. Using a simple index that combines arousal frequency, duration, and total sleep time (TST) measured on home PSG, we ascertained the prognostic value of AB for CV and overall mortality in 2782 male participants of the Osteoporotic Fractures in Men Study (MrOS) Sleep study, 424 female participants in the Study of Osteoporotic Fractures (SOF), and 4795 individuals in the Sleep Heart Health Study (SHHS). We hypothesized that a high AB is associated with long-term mortality.
Methods
Study populations
The MrOS Sleep study recruited 3135 participants,16 of which 2892 (92.2%) had PSG data available for analysis. The SOF sleep study recruited 461 participants,16 with 453 (98.3%) with available PSG. The SHHS included 6841 participants,17 with 5791 (89.9%) with available PSG. Follow-up in MrOS was 11.2 ± 2.1 years, 6.4 ± 1.6 years in SOF, and 10.7 ± 3.1 years in SHHS. Cardiovascular and all-cause mortality were assessed in all studies. For recruitment and follow-up details, see the Supplementary material online and Supplementary material online, Figure S1.
In-home overnight polysomnography and sleep scoring
Overnight PSG and sleep scoring were performed using standard methodologies. For details, see the Supplementary material online.
Characterization of arousal burden
Other measures
All participants were required to attend a clinical interview and complete an enrolment form that contained a questionnaire on medical history in advance of overnight PSG recordings (see Supplementary material online). Blood pressure was measured during the clinical visit. From overnight PSG, we derived the mean respiratory rate,16 the time of sleep spent below 90% oxygen saturation,18 average ventricular rate, the apnoea-hypopnea index (AHI) and the periodic limb movement index (PLMI).
Statistical analysis
Arousal burden data were divided into quartiles for Kaplan–Meier curve survival analysis and log-rank testing. Anthropometric data, lifestyle metrics, and medical history were compared using dichotomized AB (Q4 vs. Q1–Q3) and Student’s t-test and χ 2 test, respectively. Cox proportional hazard models were constructed for continuous and categorical AB variables. The proportionality of hazard ratio (HR) was tested using cumulative sums of martingale residuals. Correlations were assessed using Spearman’s rank coefficient. Exposure–response relationships were evaluated separately for men and women. We used restricted cubic splines with knots at the 5th, 35th, 65th, and 95th percentile to explore the potential non-linear association of the continuous variables with the outcome. Estimations for the exposure variables were made separately varying over their default range while adjusting the covariates to their median value. The Wald χ2 test determined the effect of explanatory variables in a multivariable model. A P-value of 0.05 was considered statistically significant.
The associations between AB and mortality and AI with mortality were assessed with Kaplan–Meier curves and Cox proportional hazard models. Schenfeld’s global test was applied to evaluate the proportionality of hazards. Cumulative incidence function and Fine–Gray subdistribution hazard model were applied to observe associations in the presence of competing risk.
MATLAB (R2019a, MathWorks, Natick, MA, USA) and R statistical software (R Foundation for Statistical Computing, Vienna, Austria) were used for statistical analysis and computing.
Results
Participant characteristics
At the baseline visit, MrOS cohort participants were 76.6 ± 5.5 years old. Almost half of them were overweight (Table 1). Half of the men had a history of hypertension, and 13% had diabetes, while 17.3% reported histories of coronary artery disease/myocardial infarction (CAD/MI), 3.7% stroke, and 6.1% heart failure.
Cohort characteristics of the Osteoporotic Fractures in Men Study and the Study of Osteoporotic Fractures
| MrOS (men) | SOF (women) | |||||||
|---|---|---|---|---|---|---|---|---|
| All subjects | AB ≤8.5% | AB >8.5% | P -value | All subjects | AB ≤6.5% | AB >6.5% | P -value | |
| Subjects (n) | 2782 | 2179 | 603 | 424 | 303 | 121 | ||
| Anthropometric and ethnicity data | ||||||||
| Age (years) | 76.6 ± 5.5 | 76.1 ± 5.5 | 77.4 ± 5.4 | < 0.001 | 82.9 ± 3.2 | 82.8 ± 3.2 | 83.4 ± 3.3 | 0.082 |
| White | 2526 (90.8) | 1961 (90) | 565 (93.7) | 0.002 | 397 (93.6) | 281 (92.7) | 116 (95.9) | 0.234 |
| African-American | 92 (3.3) | 77 (3.5) | 15 (2.5) | 0.209 | 27 (6.4) | 22 (7.3) | 5 (4.1) | 0.234 |
| Asian | 82 (2.9) | 68 (3.1) | 14 (2.3) | 0.312 | ||||
| Other | 82 (2.9) | 70 (3.2) | 12 (2.0) | 0.120 | ||||
| Body weight | ||||||||
| BMI (kg/m2) | 27.2 ± 3.8 | 26.9 ± 3.7 | 27.9 ± 4.1 | < 0.001 | 27.7 ± 4.6 | 27.7 ± 4.6 | 27.5 ± 4.5 | 0.596 |
| Overweight | 1375 (49.4) | 1072 (49.2) | 304 (50.4) | 0.597 | 169 (39.9) | 121 (39.9) | 48 (39.6) | 0.951 |
| Obese | 557 (20.1) | 401 (18.4) | 156 (25.9) | < 0.001 | 125 (29.5) | 92 (30.4) | 33 (27.3) | 0.529 |
| Cardiac assessment | ||||||||
| Ventricular rate (b.p.m.) | 80 ± 14.1 | 79.9 ± 14.1 | 80.5 ± 14 | 0.437 | 65.3 ± 9.7 | 64.9 ± 9.1 | 66.1 ± 11 | 0.278 |
| AF | 295 (10.6) | 229 (10.5) | 66 (11) | 0.407 | ||||
| SBP (mmHg) | 126.5 ± 16.5 | 126.4 ± 16.6 | 127.2 ± 16.1 | 0.268 | 137.9 ± 17.6 | 137.7 ± 17.4 | 138.3 ± 18 | 0.731 |
| DBP (mmHg) | 67.5 ± 9.5 | 67.4 ± 9.5 | 67.6 ± 9.5 | 0.690 | 76.9 ± 8.6 | 76.9 ± 8.6 | 76.9 ± 8.6 | 0.982 |
| Lifestyle | ||||||||
| Never-smokers | 1107 (39.8) | 891 (40.9) | 219 (36.3) | 0.043 | 271 (63.9) | 197 (65.0) | 74 (61.2) | 0.455 |
| Ex-smokers | 1619 (58.2) | 1246 (57.2) | 373 (61.9) | 0.039 | 146 (34.4) | 99 (32.7) | 47 (38.8) | 0.227 |
| Current smokers | 56 (2.0) | 42 (1.9) | 14 (2.3) | 0.542 | 7 (1.7) | 7 (2.31) | 0 | 0.091 |
| Current alcohol consumers | 1825 (65.6) | 1428 (65.5) | 398 (66.0) | 0.830 | 157 (37.0) | 108 (35.6) | 49 (40.5) | 0.350 |
| Medical history | ||||||||
| Stroke | 102 (3.67) | 86 (3.95) | 16 (2.7) | 0.135 | 59 (13.9) | 43 (14.2) | 16 (13.2) | 0.794 |
| CAD/MI | 481 (17.3) | 366 (16.8) | 115 (19) | 0.191 | 55 (12.9) | 33 (10.9) | 22 (18.2) | 0.044 |
| CHF | 170 (6.11) | 120 (5.55) | 50 (8.3) | 0.013 | 36 (8.5) | 25 (8.25) | 11 (9.1) | 0.779 |
| Asthma | 220 (7.91) | 178 (8.17) | 42 (6.9) | 0.332 | 53 (12.5) | 45 (14.8) | 8 (6.6) | 0.021 |
| COPD | 145 (5.21) | 105 (4.8) | 40 (6.6) | 0.076 | ||||
| HTN | 1389 (50) | 1078 (49.5) | 311 (51.9) | 0.361 | 252 (59.4) | 181 (59.7) | 71 (58.7) | 0.841 |
| Depression | 48 (11.3) | 33 (10.9) | 15 (12.4) | 0.659 | ||||
| Parkinson | 31 (1.11) | 27 (1.24) | 4 (0.66) | 0.233 | ||||
| Diabetes | 363 (13.0) | 281 (12.9) | 83 (13.8) | 0.576 | 58 (13.7) | 35 (11.5) | 23 (19.0) | 0.043 |
| Overnight polysomnography | ||||||||
| WASO (min) | 114.9 ± 67 | 110 ± 64.7 | 132.8 ± 70 | < 0.001 | 103.4 ± 72 | 91.4 ± 68 | 133.6 ± 76 | < 0.001 |
| TST (min) | 355 ± 69.4 | 362.4 ± 65 | 329.7 ± 78.2 | < 0.001 | 348.6 ± 77.5 | 357.5 ± 74.6 | 326.2 ± 80.3 | <0.001 |
| T90 (min) | 14.5 ± 33 | 14.6 ± 34 | 13.9 ± 32 | 0.680 | 12.9 ± 36 | 14.2 ± 40 | 9.7 ± 21.6 | 0.240 |
| RR (min−1) | 14.5 ± 1.9 | 14.6 ± 1.9 | 14.4 ± 1.9 | 0.230 | 15.3 ± 1.8 | 15.3 ± 1.8 | 15.4 ± 1.7 | 0.445 |
| AHI (h − 1) | 20.1 ± 12.9 | 17.1 ± 10.30 | 30.8 ± 15.3 | < 0.001 | 27.6 ± 18.3 | 23.1 ± 14.3 | 38.7 ± 22.2 | <0.001 |
| PLMI (h − 1) | 10.6 ± 9.9 | 10.5 ± 9.8 | 10.9 ± 10.1 | 0.462 | 13.3 ± 19 | 12.7 ± 19.4 | 14.8 ± 18 | 0.298 |
Data are presented as mean ± standard deviation, or n (%). Bold values indicate significant P-values < 0.05.
AB, arousal burden; AF, atrial fibrillation; AHI, apnoea-hypopnoea index; BMI, body mass index; CAD, coronary artery index; CHF, congestive heart failure; COPD, chronic obstructive pulmonary disease; DBP, diastolic blood pressure; HTN, hypertension; MI, myocardial infarction; MrOS, Osteoporotic Fractures in Men Study; PLMI, periodic limb movement index; RR, respiratory rate; SBP, systolic blood pressure; SOF, Study of Osteoporotic Fractures; T90, time of sleep spent below 90% oxygen saturation; TST, total sleep time; WASO, wake after sleep onset.
Women in the SOF cohort were 82.9 ± 3.2 years old at baseline (Table 1). Nearly 40% were overweight, and about 60% had a history of hypertension, and 13.7% had diabetes. The histories of stroke, CAD/MI, and heart failure were 13.9%, 12.9%, and 8.5%, respectively.
The SHHS cohort included 2574 women and 2221 men (Table 2). The average age was 64 years. The prevalence of CAD/MI in men was approximately twice that of women (11.1% vs. 8.4%). About 3.6% of men and 4.2% of women had a history of heart failure, 16.5% of men and 8.3% of women had a history of stroke.
Cohort characteristics of the Sleep Heart Health Study
| Men | Women | |||||||
|---|---|---|---|---|---|---|---|---|
| All subjects | AB ≤8.5% | AB >8.5% | P -Value | All subjects | AB ≤6.5% | AB >6.5% | P -Value | |
| Subjects (n) | 2221 | 1643 | 578 | 2574 | 1918 | 656 | ||
Anthropometric and ethnicity data | ||||||||
| Age (years) | 64 ± 10.9 | 62.9 ± 11.1 | 66.9 ± 9.8 | <0.001 | 63.7 ± 11.4 | 62.3 ± 11.3 | 67.8 ± 10.6 | <0.001 |
| White | 1956 (88) | 1444 (87.9) | 512 (88.6) | 0.658 | 2224 (86.4) | 586 (85.4) | 586 (89.3) | 0.011 |
| African-American | 128 (5.8) | 83 (5) | 45 (7.8) | 0.015 | 180 (7) | 137 (7.1) | 43 (6.6) | 0.612 |
| Other | 137 (6.2) | 116 (7.1) | 21 (3.6) | 0.003 | 170 (6.6) | 143 (7.5) | 27 (4.1) | 0.003 |
Body weight | ||||||||
| BMI (kg/m2) | 28.5 ± 4.3 | 28.2 ± 4.1 | 29.2 ± 4.9 | <0.001 | 28.1 ± 5.6 | 27.9 ± 5.5 | 28.4 ± 5.9 | 0.06 |
| Overweight | 1072 (48.3) | 822 (50.0) | 250 (43.3) | 0.005 | 955 (37.1) | 725 (37.8) | 230 (35.1) | 0.21 |
| Obese | 687 (30.9) | 468 (28.5) | 219 (37.9) | < 0.001 | 792 (30.8) | 574 (29.9) | 218 (33.2) | 0.113 |
| Cardiac assessment | ||||||||
| Ventricular rate (b.p.m.) | 65 ± 10 | 65 ± 10.1 | 64.4 ± 9.1 | 0.369 | 64.3 ± 9.9 | 64.2 ± 9.9 | 65.1 ± 10 | 0.213 |
| AF | 38 (1.7) | 25 (1.5) | 13 (2.3) | 0.246 | 24 (0.9) | 18 (0.9) | 8 (1.2) | 0.534 |
| SBP (mmHg) | 125.4 ± 18.5 | 125.1 ± 18.5 | 127.6 ± 19 | 0.054 | 125.9 ± 18.6 | 125.7 ± 18.4 | 128 ± 20.5 | 0.022 |
| DBP (mmHg) | 72.5 ± 10.7 | 72.4 ± 10.7 | 73.2 ± 10.7 | 0.276 | 72.3 ± 11.2 | 72.4 ± 11.2 | 71.5 ± 11.2 | 0.241 |
Lifestyle | ||||||||
| Never-smokers | 768 (34.6) | 573 (34.9) | 195 (33.7) | 0.621 | 1458 (56.6) | 1081 (56.4) | 377 (57.5) | 0.621 |
| Ex-smokers | 1222 (55) | 892 (54.3) | 330 (57.1) | 0.244 | 882 (34.3) | 655 (34.2) | 227 (34.6) | 0.833 |
| Current smokers | 231 (10.4) | 178 (10.8) | 53 (9.2) | 0.26 | 234 (9.1) | 182 (9.5) | 52 (7.9) | 0.229 |
Medical history | ||||||||
| Stroke | 367 (16.5) | 259 (15.8) | 108 (18.7) | 0.104 | 213 (8.3) | 147 (7.7) | 66 (10.1) | 0.05 |
| CAD/MI | 246 (11.1) | 163 (9.9) | 83 (14.4) | 0.003 | 217 (8.4) | 152 (7.9) | 65 (9.9) | 0.114 |
| CHF | 79 (3.56) | 54 (3.29) | 25 (4.33) | 0.245 | 109 (4.2) | 69 (3.6) | 40 (6.1) | 0.006 |
| HTN | 924 (35.9) | 629 (38.3) | 295 (51.0) | < 0.001 | 1018 (39.5) | 715 (37.3) | 303 (46.2) | < 0.001 |
| Diabetes | 189 (7.3) | 129 (7.9) | 60 (10.4) | 0.060 | 159 (6.2) | 104 (5.4) | 55 (8.4) | 0.007 |
| Overnight polysomnography | ||||||||
| WASO (min) | 67.4 ± 46 | 59.7 ± 42 | 89.3 ± 52 | < 0.001 | 57.4 ± 41 | 50.6 ± 36.6 | 77.4 ± 45.5 | < 0.001 |
| TST (min) | 354.6 ± 61.1 | 361 ± 57.4 | 336 ± 67.4 | < 0.001 | 371.6 ± 64.6 | 379 ± 60.7 | 349.8 ± 71 | < 0.001 |
| T90 (min) | 11.4 ± 35.2 | 11.5 ± 35.5 | 10.9 ± 31.9 | 0.809 | 13.4 ± 39 | 13.3 ± 39.4 | 14.1 ± 35.7 | 0.748 |
| RR (min−1) | 14.7 ± 1.7 | 14.7 ± 1.7 | 14.8 ± 1.7 | 0.924 | 14.7 ± 1.7 | 14.7 ± 1.7 | 14.8 ± 1.7 | 0.224 |
| AHI (h − 1) | 12.3 ± 14.1 | 8.7 ± 9.1 | 22.9 ± 19.5 | < 0.001 | 7.2 ± 10.5 | 5.3 ± 7.1 | 12.8 ± 15.7 | < 0.001 |
Data are presented as mean ± standard deviation, or n (%). Bold values indicate significant P-values < 0.05.
AB, arousal burden; AF, atrial fibrillation; AHI, apnoea-hypopnoea index; BMI, body mass index; CAD, coronary artery disease; CHF, congestive heart failure; DBP, diastolic blood pressure; HTN, hypertension; MI, myocardial infarction; SBP, systolic blood pressure; T90, time of sleep spent below 90% oxygen saturation; TST, total sleep time; RR, respiratory rate; WASO, wake after sleep onset.
Systolic and diastolic blood pressure recorded at the sleep visit was greater in women of SOF than other cohorts, while the mean heart rate of MrOS participants was higher than SOF and SHHS cohorts.
Polysomnographic assessment
Total sleep time recorded on PSG were 5.9 ± 1.2, 5.8 ± 1.3, 5.9 ± 1.0, and 6.2 ± 1.1 h in the MrOS, SOF, SHHS-men, and women cohorts; the AHI values were 20 ± 12.9, 27.6 ± 18.3, 12.3 ± 14.1, and 7.2 ± 10.5 h−1, respectively. Periodic limb movement index in MrOS and SOF cohorts were 10.6 ± 9.9 and 13.3 ± 19 h−1, respectively (not measured in SHHS).
The AB was significantly higher in the MrOS cohort than in the SOF cohort (6.60 ± 3.34% vs. 5.50 ± 3.05%, P < 0.001), and also higher in SHHS-men than in SHHS-women (7.14 ± 3.72% vs. 5.43 ± 2.62%, P < 0.001).
The AB correlated only weakly with TST (MrOS: ρ = −0.18, P < 0.001; SOF: ρ = −0.20, P < 0.001; SHHS: ρ = −0.20, P < 0.001; Supplementary material online, Figure S2) and people with a low AB tended to sleep longer. The AB was also correlated with AHI (>0.4 in all cohorts except SHHS-women; Supplementary material online, Figure S3).
Cardiovascular and all-cause mortality
In the MrOS cohort, mortality data were available for 2782 participants (Supplementary material online, Figure S1 ). During the follow-up period of 11.2 ± 2.1 years, 665 (23.4%) men died. Causes of deaths included CV disease (n = 236; 35.5%), cancer (n = 146; 22%), pulmonary disease (n = 55; 8.3%), and others (n = 228; 34.3%).
In the SOF cohort, mortality data were available for 424 women. During the 6.4 ± 1.6 years of follow-up, 105 (24.8%) women died, including 47 (44.8%) CV deaths, 17 (16.2%) cancer deaths, 27 (25.7%) pulmonary deaths, and 14 (13.3%) deaths due to other reasons.
In the SHHS cohort, mortality data were available for 4795 individuals. During the follow-up period of 10.7 ± 3.1 years, 987 (20.6%) individuals died (525 men, 462 women). Among those, 344 (34.9%) were CV deaths. Kaplan–Meier survival analysis of AB quartiles demonstrates the association between AB and all-cause mortality (Figure 1). When comparing people in Q4 against all others (men: AB >8.5%; women: AB >6.5%), all-cause mortality was greater in all cohorts (MrOS: 3.2%, P = 0.017; SOF: 8.9%, P = 0.039; SHHS-men: 10.2%, P < 0.001; SHHS-women: 8.4%, P < 0.001; Figure 2).
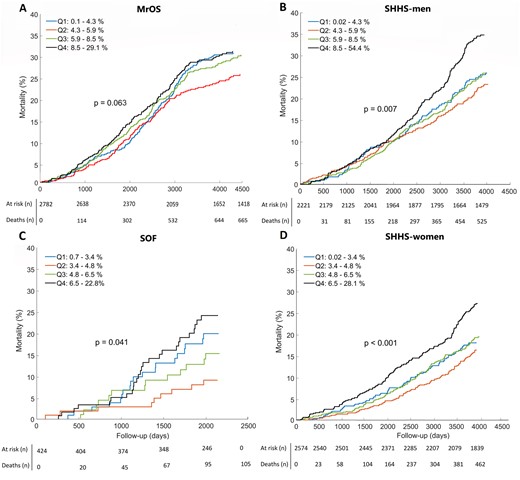
Arousal burden and all-cause mortality. Kaplan–Meier curves indicate arousal burden quartiles for (A) men from the Osteoporotic Fractures in Men Study (MrOS) Sleep cohort, (B) men from the Sleep Heart Health Study (SHHS), (C) women from the Study of Osteoporotic Fractures (SOF) cohort, and (D) women from the Sleep Heart Health Study. The P-values show log-rank test results. Q1–Q4, quartiles 1–4.
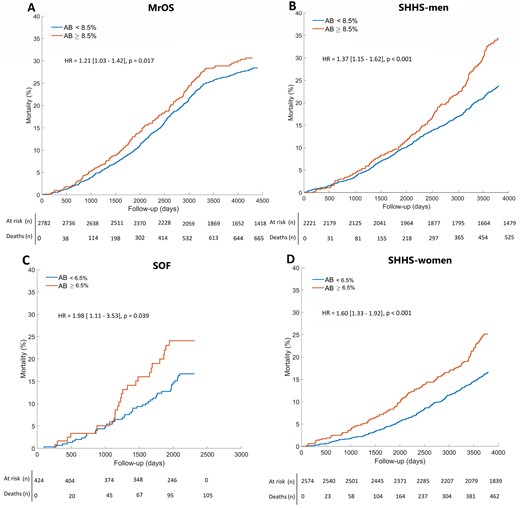
Arousal burden and all-cause mortality. Kaplan–Meier curves indicate dichotomised arousal burden data for (A) men from the Osteoporotic Fractures in Men Study (MrOS) Sleep cohort, (B) men from the Sleep Heart Health Study (SHHS), (C) women from the Study of Osteoporotic Fractures (SOF) cohort, and (D) women from the Sleep Heart Health Study. The P-values show log-rank test results. HR, hazard ratio.
When assessing the competing risk of CV vs. non-CV deaths across all four cohorts, the highest AB quartile was associated with relatively higher CV mortality in the MrOS, SOF, and SHHS-women cohorts (4.8%, 8%, and 5.5%, respectively; Figure 3). Q4 was also associated with a higher probability of non-CV mortality in the SOF and SHHS-men and SHHS-women cohorts (3.5%, 6.9%, and 7.4%).
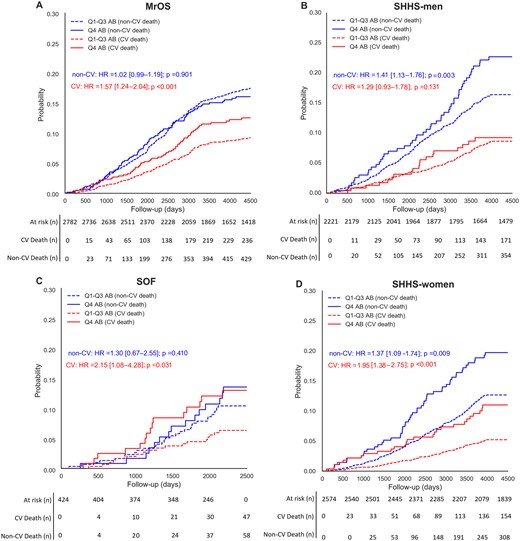
Commutative incident function curves compare the competing risk of arousal burden of cardiovascular, non-cardiovascular and all-cause mortality in (A) men from the Osteoporotic Fractures in Men Study (MrOS) Sleep cohort, (B) men from the Sleep Heart Health Study (SHHS), (C) women from the Study of Osteoporotic Fractures (SOF) cohort, and (D) women from the Sleep Heart Health Study. Hazard ratios (HR) and P-values were estimated through a sub-distributional Fine–Gray hazard model.
Characteristics of participants in the highest AB quartiles are summarized in Tables 1 and 2. In the MrOS cohort, men in Q4 were more likely to be older, obese, ex-smokers, have a history of heart failure and chronic obstructive pulmonary disease, and have higher AHI values. In the SOF cohort, women in Q4 were more likely to be diabetic, asthmatic, have a history of CAD/MI and suffering from severe SDB. There was no significant association between high AB and history of stroke and prevalence of hypertension either in SOF or MrOS participants. Neither was there an association with chronic obstructive pulmonary disease or depression. In SHHS-men in Q4 were more likely to be older, overweight, or obese, have a history of congestive heart failure, hypertension, and to have a moderate-to-severe degree of sleep apnoea. In SHHS-women in Q4 were likely to be older, white, have a history of CAD/MI, hypertension, diabetes, stroke, and mild-to-moderate sleep apnoea and higher systolic blood pressure.
In univariate Cox proportional hazard analysis, AB >8.5% and AB >6.5% were significantly associated with all-cause mortality in men [MrOS: HR 1.21, 95% confidence interval (CI) 1.03–1.42, P = 0.02; SHHS-men: HR 1.37 (1.15–1.62), P < 0.001] and women [SOF: HR 1.98 (1.11–3.53), P = 0.02; SHHS-women: HR 1.60 (1.33–1.92), P < 0.001] (Table 3). Arousal burden >6.5% was also associated with CV mortality in women [SOF: HR 2.15 (1.08–4.28), P = 0.031; SHHS-women: HR 1.95 (1.38–2.75), P < 0.001]. In male cohorts, AB >8.5% was associated with CV mortality in MrOS [HR = 1.57 (1.24–2.04), P < 0.001] but not in SHHS-men (P = 0.131).
Association of arousal burden with cardiovascular and all-cause mortality
| All-cause mortality | Cardiovascular mortality | Non-cardiovascular Mortality | ||||||||||
|---|---|---|---|---|---|---|---|---|---|---|---|---|
| Univariate analysis | Multivariable analysis | Univariate analysis | Multivariable analysis | Univariate analysis | Multivariable analysis | |||||||
| HR (95% CI) | P | HR (95% CI) | P | HR (95% CI) | P | HR (95% CI) | P | HR (95% CI) | P | HR (95% CI) | P | |
| MrOS sleep | ||||||||||||
| AB (%) | 1.03 (1.00–1.05) | 0.011 | 1.02 (1.00–1.04) | 0.049 | 1.05 (1.02–1.09) | 0.003 | 1.04 (1.00–1.08) | 0.028 | 1.01 (0.99–1.04) | 0.03 | 0.99 (0.97–1.02) | 0.955 |
| AB >8.5% | 1.21 (1.03–1.42) | 0.02 | 1.11 (0.94–1.32) | 0.261 | 1.57 (1.24–2.04) | <0.001 | 1.35 (1.02–1.79) | 0.034 | 1.02 (0.99–1.25) | 0.9 | 0.95 (0.76–1.19) | 0.651 |
| SOF | ||||||||||||
| AB (%) | 1.11 (1.03–1.19) | 0.002 | 1.06 (1.00–1.13) | 0.050 | 1.14 (1.05–1.23) | 0.004 | 1.14 (1.05–1.25) | 0.002 | 1.06 (0.97–1.15) | 0.201 | 1.05 (0.96–1.15) | 0.255 |
| AB >6.5% | 1.98 (1.11–3.53) | 0.02 | 1.58 (1.01–2.42) | 0.038 | 2.15 (1.08–4.28) | 0.031 | 2.17 (1.04–4.50) | 0.037 | 1.30 (0.70–2.41) | 0.410 | 1.31 (0.67–2.55) | 0.431 |
| SHHS-men | ||||||||||||
| AB (%) | 1.04 (1.02–1.06) | <0.001 | 1.02 (0.98–1.06) | 0.199 | 1.01 (0.96–1.06) | 0.661 | 0.96 (0.90–1.03) | 0.251 | 1.05 (1.01–1.08) | 0.004 | 1.03 (0.98–1.07) | 0.194 |
| AB >8.5% | 1.37 (1.15–1.62) | <0.001 | 1.31 (1.06–1.62) | 0.011 | 1.29 (0.93–1.78) | 0.131 | 1.24 (0.86–1.79) | 0.271 | 1.41 (1.13–1.76) | 0.003 | 1.34 (1.04–1.74) | 0.005 |
| SHHS-women | ||||||||||||
| AB (%) | 1.10 (1.07–1.13) | <0.001 | 1.07 (1.03–1.12) | 0.003 | 1.15 (1.08–1.22) | <0.001 | 1.12 (1.06–1.20) | <0.001 | 1.10 (1.06–1.16) | <0.001 | 1.09 (1.04–1.15) | 0.001 |
| AB >6.5% | 1.60 (1.33–1.92) | <0.001 | 1.21 (1.06–1.42) | 0.012 | 1.95 (1.38–2.75) | <0.001 | 1.60 (1.12–2.28) | 0.009 | 1.37 (1.09–1.74) | 0.009 | 1.28 (1.01–1.63) | 0.038 |
HR for AB (%) indicate the risk increment per 1% increase in AB. For categorical risk analysis, AB was dichotomized on the 4th quartile (men: AB >8.5; women: AB >6.5). Multivariable analysis was adjusted for total sleep duration, age, history of stroke, coronary artery disease/myocardial infarction, congestive heart failure, diabetes, hypertension, mean heart rate, mean respiratory rate, systolic and diastolic blood pressure, time of sleep spent below 90% oxygen saturation, total wake after sleep onset, categorized body mass index, apnoea-hypopnea index, and smoking habit. Bold values indicate significant P-values < 0.05.
AB, arousal burden; CI, confidence interval; HR, hazard ratio; MrOS, Osteoporotic Fractures in Men Study; SHHS, Sleep Heart Health Study; SOF, Study of Osteoporotic Fractures.
After adjusting the regression models for TST, age, average heart rate, respiratory rate, systolic and diastolic blood pressure, time spent with oxygen desaturation below 90%, history of hypertension, stroke, MI, congestive heart failure, diabetes and hypertension, body mass index category, AHI, and smoking habits, AB >8.5% remained associated with CV mortality in the MrOS cohort [HR 1.35 (1.02–1.79), P = 0.034] but not for all-cause mortality (Table 3). After adjusting the SOF cohort model for the same variables, AB >6.5% remained associated with all-cause [HR 1.58 (1.01–2.42), P = 0.038] and CV mortality [HR 2.17 (1.04–4.50), P = 0.037]. In the adjusted model, AB was also associated with all-cause mortality in SHHS-men [HR 1.31 (1.06–1.62), P = 0.011] and SHHS-women [HR 1.21 (1.06–1.42), P = 0.012] and CV mortality in SHHS-women [HR 1.60 (1.12–2.28), P = 0.009] (Table 3). Concerning non-CV mortality, the highest AB quartile was associated with increased risk in both SHHS-men [HR 1.34 (1.04–1.74), P = 0.005] and SHHS-women [HR 1.28 (1.01–1.63), P < 0.038].
For a detailed mortality analysis of AI, see Supplementary material online. Kaplan–Meier analysis of AI (Supplementary material online, Figure S4) as well as competing risk analysis for CV and non-CV mortality (Supplementary material online, Figure S5) showed a somewhat weaker association of AI with mortality, although AI was strongly correlated with AB (Supplementary material online, Figure S6). Kaplan–Meier curves of combined AB and AI did not demonstrate any significant difference between subgroups for all-cause (Supplementary material online, Figure S7) or CV mortality (Supplementary material online, Figure S8).
To further explore the non-linear association between AB and mortality in men and women, we collated datasets and assessed exposure–response relationships (Figure 4), adjusting for the same covariates. We observed a significant gender effect on the prognostic value of AB for mortality (all-cause: P = 0.034; CV: P = 0.030). Overall, the association between AB and mortality appears to be stronger in women than in men (Graphical abstract). Men demonstrated an initial decrease in all-cause mortality up to almost AB ≈6% [logHR 0.08 (0.02–0.14)], the cut-off of Q2 in Kaplan–Meier plots for men (Figure 1), followed by a gradual increase [AB 10%: logHR 0.13 (0.04–0.21), AB 20%: logHR 0.41 (0.11–0.72)]. In women, the all-cause mortality risk similarly reached the minimum value at the Q2 cut-off [AB ≈5%: logHR −0.03 (−0.12–0.07)], while an almost linear increase in all-cause mortality was observed with increasing AB [AB 10%: logHR 0.26 (0.09–0.43), AB 20%: logHR 1.07 (1.45–1.67)]. The exposure–response relationships for CV mortality were similar.
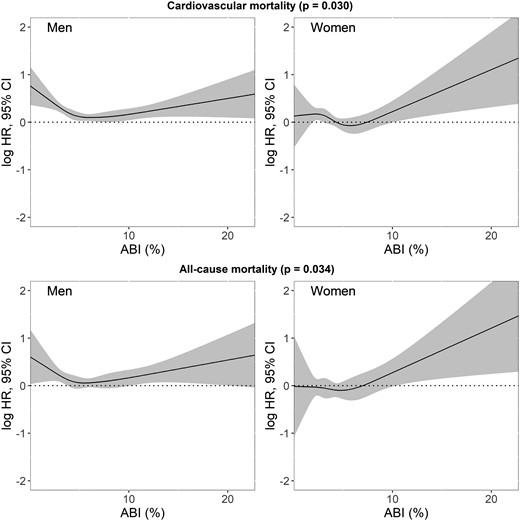
The exposure–response relationships of arousal burden and all-cause and cardiovascular mortality for men and women regardless of their cohort, adjusted for total sleep duration, age, systolic and diastolic blood pressure, average heart rate, mean respiratory rate, time spent below 90% oxygen desaturation, history of stroke, myocardial infarction/coronary artery disease, congestive heart failure, categorized body mass and apnoea/hypopnea indices, the total duration of wake after sleep onset, smoking habit, and history of hypertension and diabetes. CI, confidence interval; HR, hazard ratio. The P-values show Wald χ2 test results.
Discussion
This study is the first to evaluate the sex-specific association of sleep AB and long-term CV and all-cause mortality. Data from three large cohort studies, totalling 8001 participants demonstrate that a high AB is associated with significantly increased CV and all-cause mortality. While the frequency of arousals was lower in women than in men, the association with mortality was stronger in women.
We used two metrics to quantify nocturnal AB, AB and AI, quantifying the percentage of sleep time affected by arousal and the frequency of arousal per hour of sleep, respectively. Arousal burden correlated only weakly with total sleep duration. People with low AB tend to sleep longer, presumably due to lower levels of sleep fragmentation. The wake time after sleep onset was associated with AB in our study, but AB in itself appears to carry important prognostic information. While AB was more strongly associated with mortality than AI, both metrics confirm the relationship between AB and long-term mortality as well as the difference between genders. While the severity of SDB, periodic limb movement disorder and other sleep pathologies increase the rate of arousals, mechanisms underlying the arousal duration are less clear. Boselli et al.13 showed that the mean arousal duration is independent of age or gender. The extent and duration of arousals elicited by apnoeas are typically greater than that of hypopnoeas. Apnoeas exceeding 20 s accompanied by a minimum oxygen desaturation of 86% are likelier to be terminated by arousals longer than 11 s.15 Generally, arousal duration reflects arousal intensity and the level of concurrent autonomic activation such as post-arousal heart rate.4 Particularly in SDB, reflex control and chemoreceptor sensitivity, which determine arousal thresholds and contribute to sympathovagal disbalance and haemodynamic responses, may affect arousal duration.19
Comparing AB between the MrOS and SOF cohorts suggests lower AB in women than in men, despite their more advanced age and somewhat higher AHI and PLMI. In the SHHS cohort, AB was greater in men as was AHI, but was not associated with CV mortality, unlike AB in women. This suggests that women are more prone to arousal-related consequences than men.
Interestingly, the lowest mortality was observed among people in the 2nd AB quartile, demonstrating the non-linear relationship between AB and mortality. People experiencing infrequent arousals may suffer from elevated arousal thresholds, which could result in worse outcomes.20
Cardiovascular risk factors are more prevalent in participants with high AB; CV disease and arrhythmias are known to contribute to increased mortality.21 Importantly, AB was associated with mortality when adjusted for concomitant risk factors. Arousal-related pathological conditions, involving autonomic nervous system activation, circadian rhythm impairment due to sleep fragmentation,22 nocturnal blood pressure and heart rate rises11 , 23 , 24 or concomitant conditions such as SDB have all shown to increase all-cause and CV mortality.20 , 25 , 26 Moreover, irregular sleep duration and timing have been recently shown as risk factors of CV disease, independent of traditional CV disease risk factors and sleep quality and quantity.5 Here, we observed a significant association between history of heart failure and MI and AB in some cohorts, linking AB to CV disease. We also report a higher prevalence of diabetes in women with AB >6.5%, corroborating on the link between short sleep, type 2 diabetes, and glucose metabolism.27 , 28 However, we did not observe this relationship in men.
Strengths
This study had multiple strengths, including the large sample size and hypothesis testing across three independent cohorts; prospective evaluation of outcomes over significant time periods; the focus on hard endpoints (which are less sensitive to misclassification and are most clinically relevant); rigorously collected PSG data scored blinded to other data; and the ability to adjust for multiple potential confounders.
Limitations
All cohorts comprise predominately white men and women of predominantly middle to older age. Hence, our findings cannot be extrapolated to other races or younger individuals. Baseline exposure to various conditions was self-reported rather than systematically ascertained through medical records or direct measurement. We did not consider the possible confounding effects of medications. We did not distinguish arousal types, assuming that regardless of the cause, arousals disrupt sleep architecture the same way. In line with the American Academy of Sleep Medicine (AASM) scoring rules, subcortical arousals were not considered.29 Standard AASM 30 s sleep staging may have resulted in underestimating AB by cutting short arousals that terminated in ‘wake’ stages. Our findings were obtained on single-night in-home overnight PSG; night-to-night variability in AB may exist and affect the estimated strength of the observed associations.7
Future directions
We demonstrated a clear association between nocturnal AB and long-term CV and all-cause mortality. Arousal burden may represent a promising marker to identify patients at risk. We quantified AB using electroencephalography recordings from overnight PSG. The clinical implementation of AB assessment in routine risk stratification strategies will require easily scalable, widely accessible, and affordable techniques to estimate the duration and fragmentation of sleep and to detect arousals (e.g. wrist actigraphy or peripheral arterial tonometry).30 To determine whether a more detailed description of the AB, incorporating alternative arousal characteristics such as the frequency of wake periods or sleep stage transitions from deep to light sleep results in a better risk prediction requires further study. Arousal burden may also represent a modifiable risk factor for CV and all-cause mortality, which warrants future prospective intervention studies. Possible interventions to reduce AB require a multimodal assessment and may involve pharmacological elevation of the arousal threshold.19
Conclusions
Nocturnal AB is associated with long-term CV and all-cause mortality in women and to a lesser extent in men.
Supplementary material
Supplementary material is available at European Heart Journal online.
Data availability
All of the individual participant data generated during this study will be made available at the MrOS Online (https://mrosdata.sfcc-cpmc.net/) and SOF Online (https://sofonline.epi-ucsf.org/interface/) and sleepdata.org websites.
Funding
This study was supported through a grant from the Australian Research Council (DP0663345). The MrOS Study and the SOF Study are supported by NIH funding. The following institutes provided support: The National Institute on Aging, the National Institute of Arthritis and Musculoskeletal and Skin Diseases, the National Center for Advancing Translational Sciences, and NIH Roadmap for Medical Research (U01 AG027810, U01 AG042124, U01 AG042139, U01 AG042140, U01 AG042143, U01 AG042145, U01 AG042168, U01 AR066160, and UL1 TR000128). The National Heart, Lung, and Blood Institute provided funding for the MrOS Sleep ancillary study (R01 HL071194, R01 HL070848, R01 HL070847, R01 HL070842, R01 HL070841, R01 HL070837, R01 HL070838, and R01 HL070839), and the National Sleep Research Resource (R24-HL-114473). The SOF sleep study was supported by grant AG021918, AG026720, AG05394, AG05407, AG08415, AR35582, AR35583, AR35584, R01 AG005407, R01 AG027576‐22, 2 R01 AG005394‐22A1, 2 R01 AG027574‐22A1, HL40489, and T32 AG000212‐14. Dr S.R. was supported in part by NIH R35HL135818.
Role of funding sources: The study sponsors had no role in study design; in the collection, analysis, and interpretation of data; in the writing of the report; and in the decision to submit the paper for publication.
Conflict of interest: None.
References
American Academy of Sleep Medicine.
Author notes
Sobhan Salari Shahrbabaki and Dominik Linz share first authorship.

